
Let’s learn how to make use of the group by function in Power BI both on the Power Query and also on the DAX level.
Power Query Method:
Load an excel data. In our case we are going to use the below data.

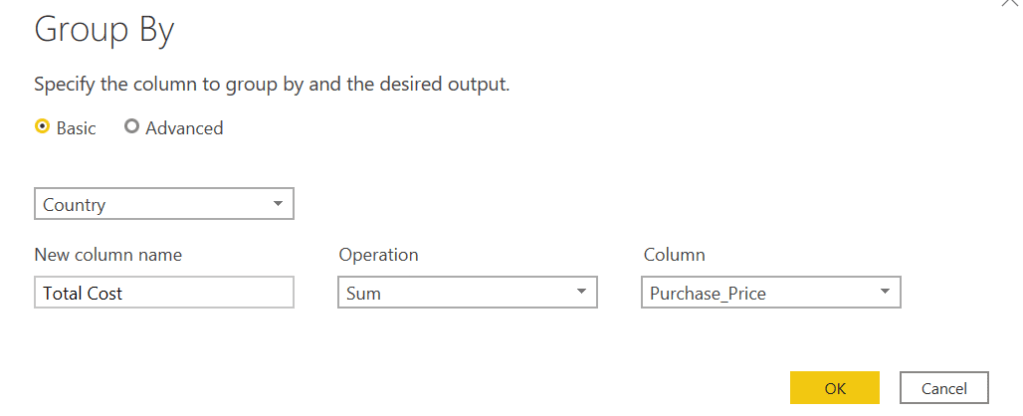
We are going to Group By the Country. Now as you can see India has two distinct customers purchasing ProdA and ProdB. Now let’s see the table that we get on grouping it. Purchase_Price will the grouping value with condition on Country.
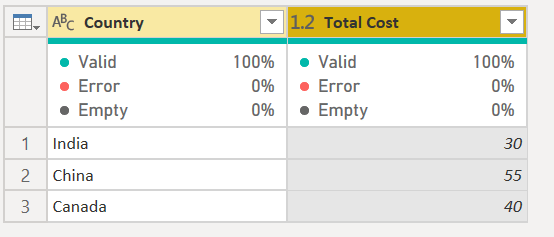
We will now get the above data as part of the grouping function. If you notice Total Cost for all Customers in each Country is Grouped and shown out.
Eg: India now has Total Cost of all the customers combined at 30, Which is the cost of CustA and CustAB combined.
Now let’s try the same thing using a DAX function.
Go back to the modelling tab and place the below DAX function under a new table.

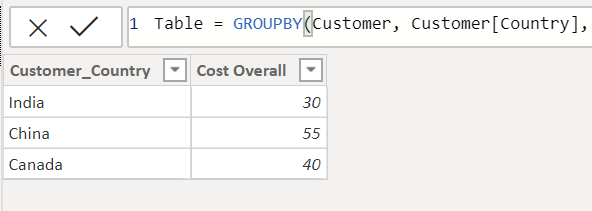
- You will get the exact same table. Note that its recommended to make use of the DAX function to improve the performance of your report when doing a Group BY function.
2. When Group By is done, you will not be allowed to make use of measures but you can make of SUMX function to call a key figure.
Do share out if you have other idea’s or how we can improve on the group by or is there other use cases for Group By.
