Group By function in Power Query and DAX – Power BI

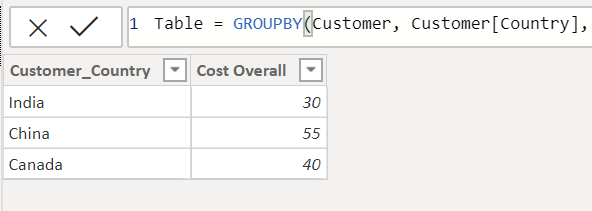
Let’s learn how to make use of the group by function in Power BI both on the Power Query and also on the DAX level. Power Query Method: Load an excel data. In our case we are going to use the below data. We are going to Group By the Country. Now as you can …

COALESCE function in Power BI – DAX

A new function was released quite recently on the Power BI. I personally believe this is very useful in terms of identifying the blanks() in row values and doing something about. Let us try understanding what it does first. Go ahead and create the table as shown below. Now lets try identifying and doing something …

Place multiple measures into charts – Power BI

Let us consider taking the below dataset. We currently have employee names of a company who have a salary column, Quantity Sold for items and Departments they work under – Count. When we place these values into a chart in Power BI we will get something like this. What if the user wants to view …

Clustering – Data Science with Power BI

I am relatively new to data science. I always kept wondering what is data science. I came across another blog post that talks about one of the Python Libraries. Its called PyCaret. So this is what I did: To install PyCaret. I Downloaded and got the anaconda’s for Python installed on my system. You too …

Design a site like this with WordPress.com
Get started